60s End of Season Stat Breakdown for 2026
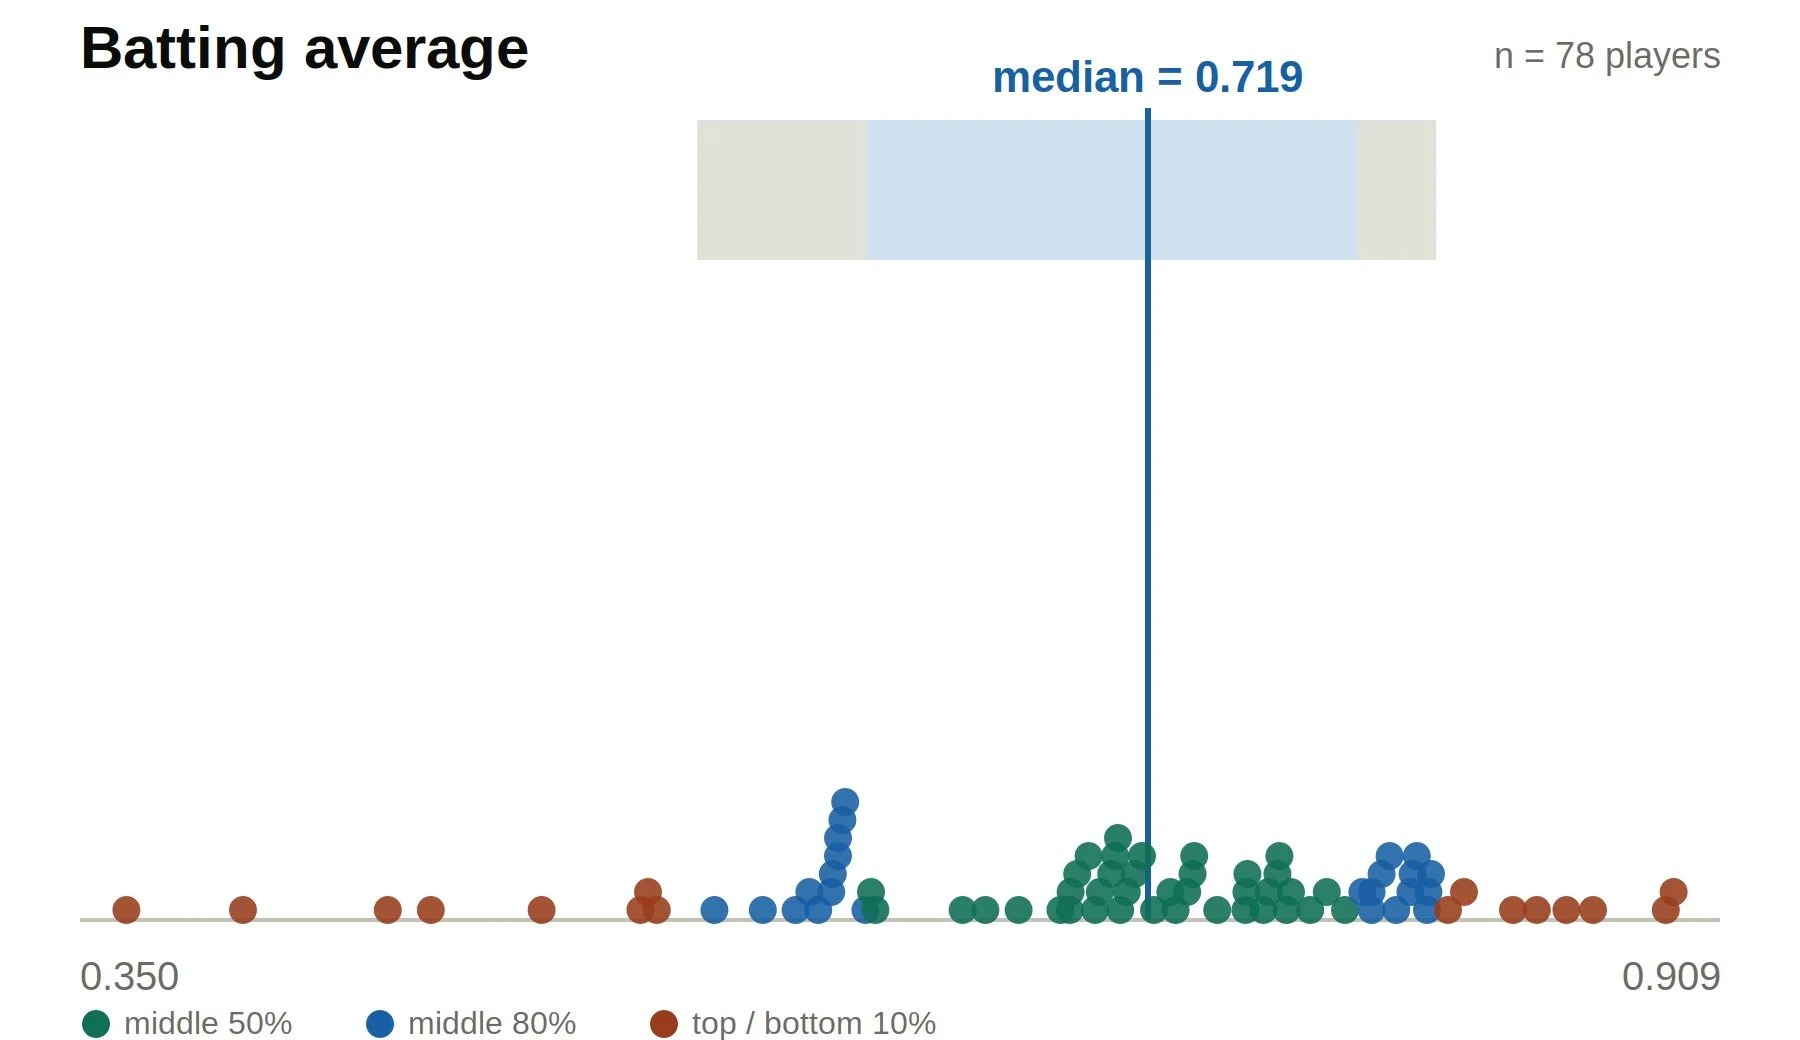
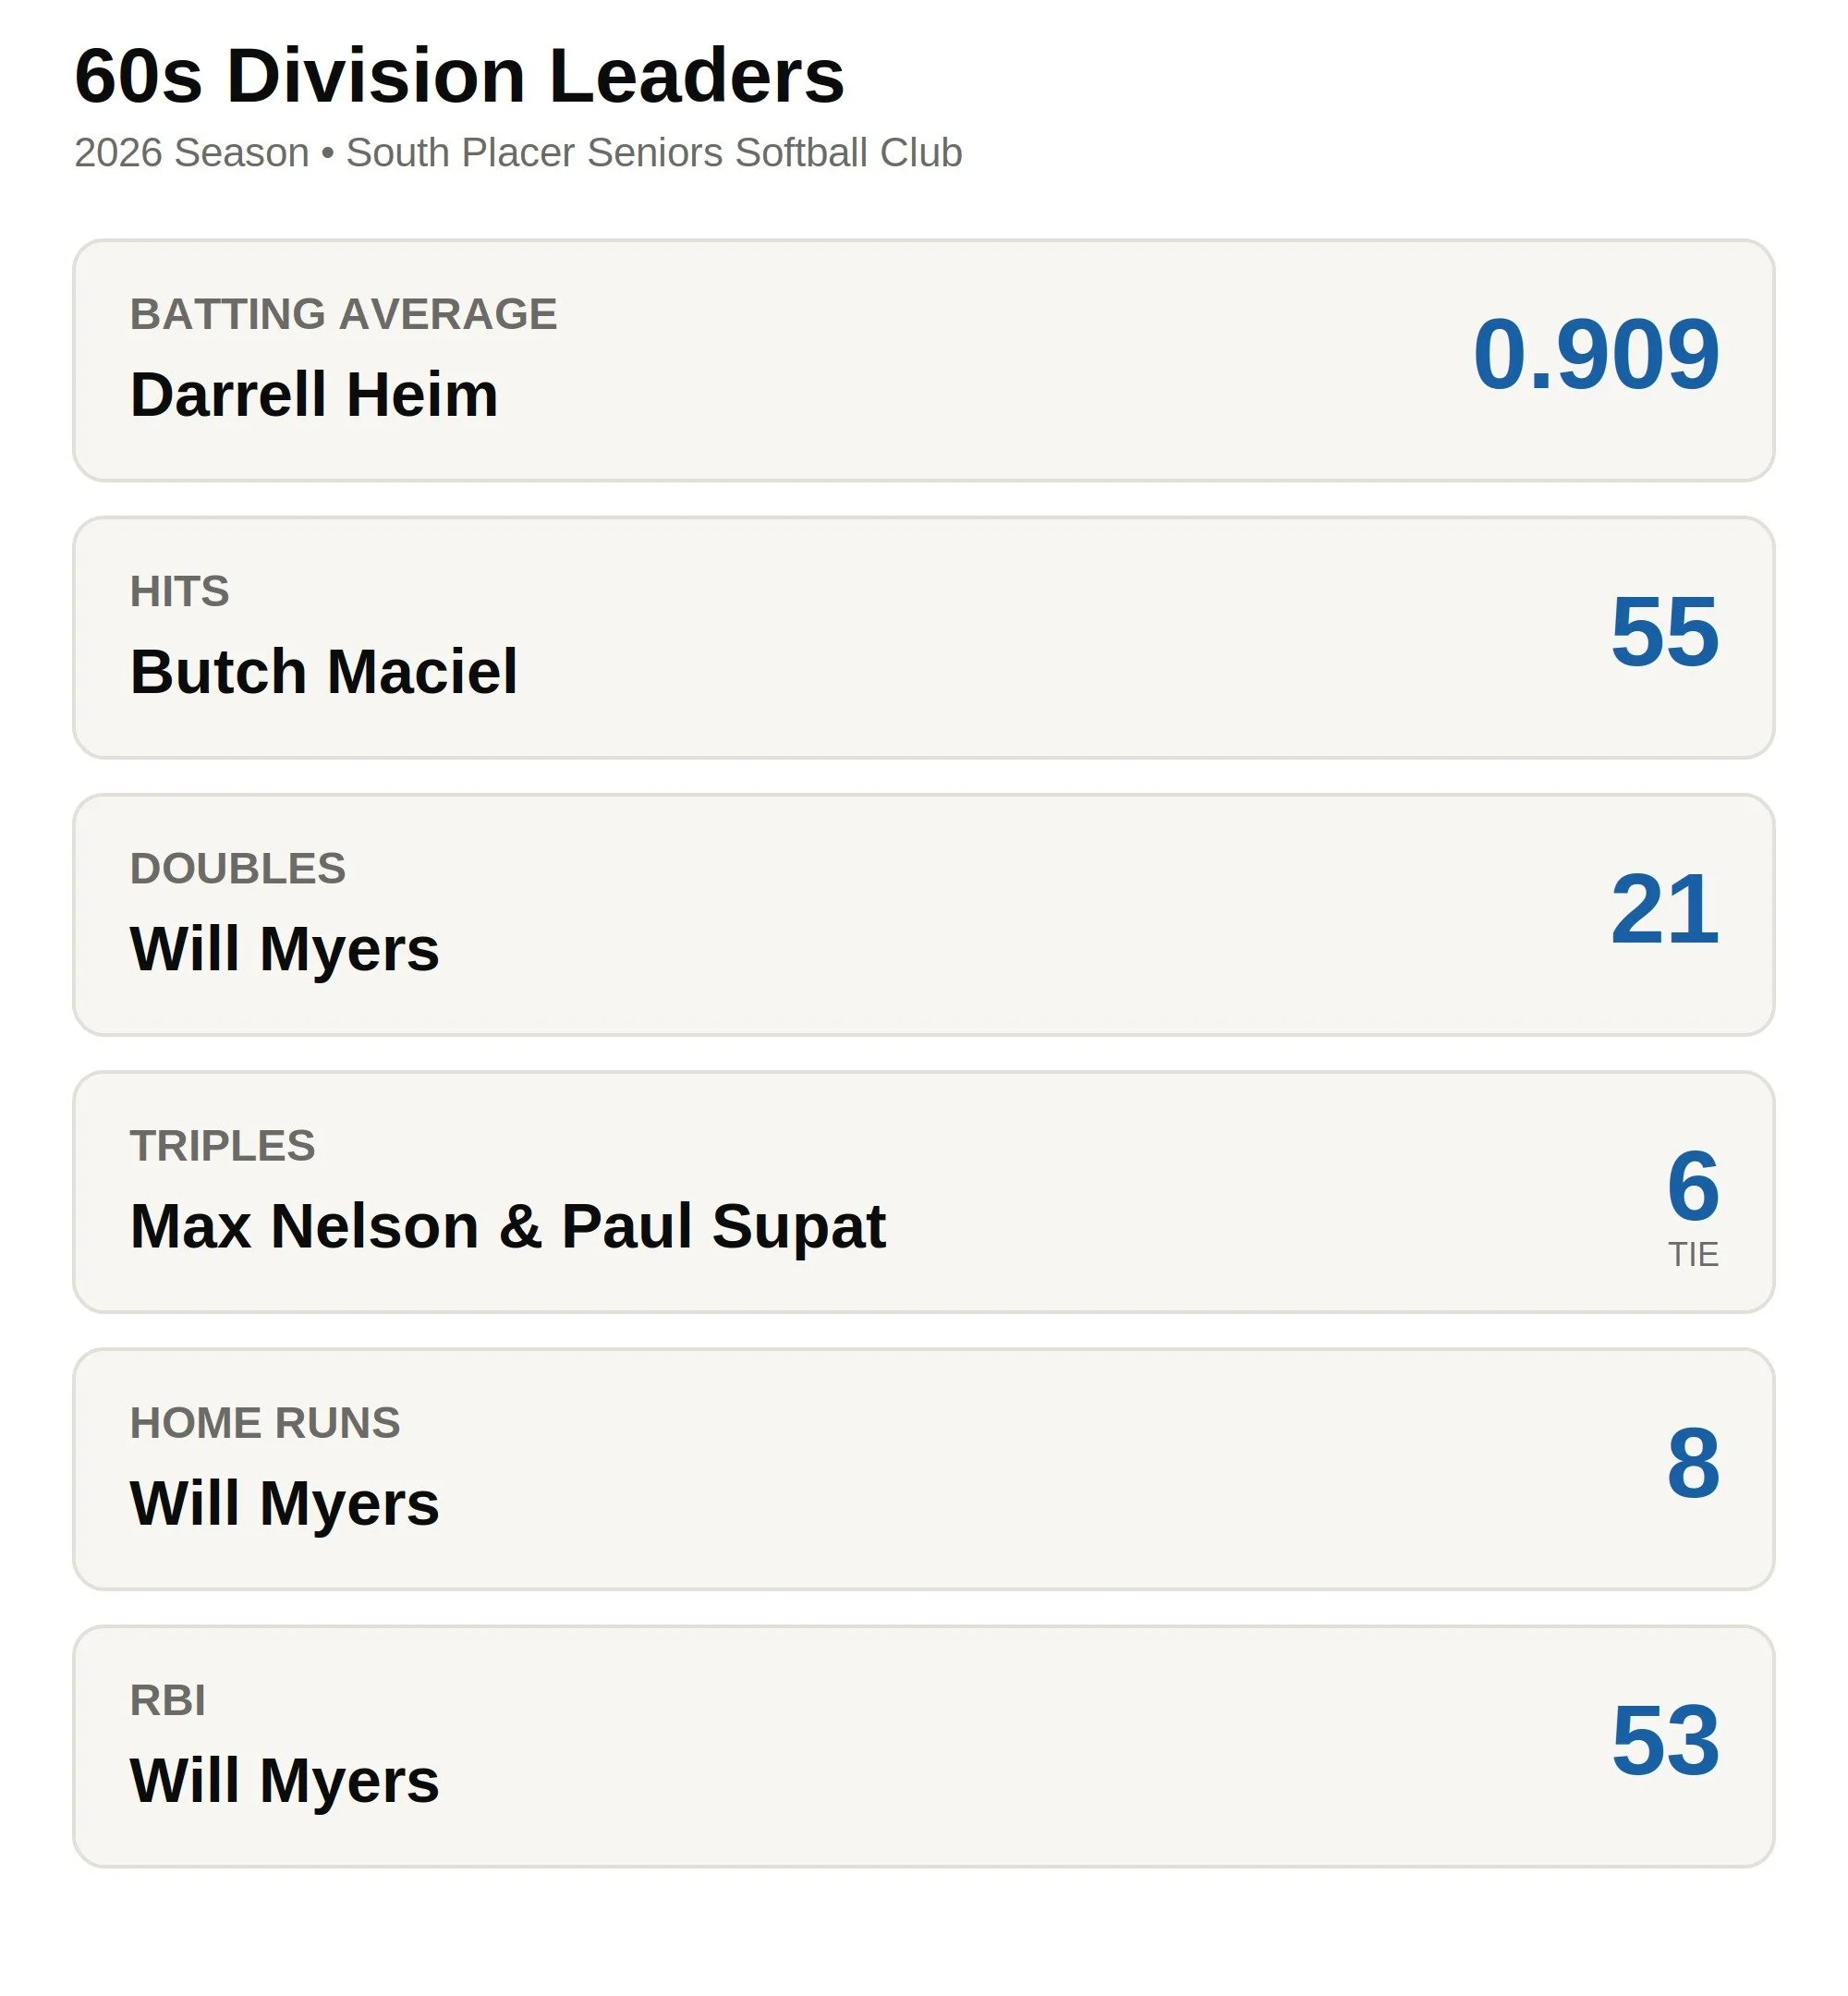
As we conclude to 2026 regular season for the 60s, we take a moment to celebrate the achievements of those who had a great year. Let’s talk about it starting with Darrell Heim who batted a staggering .909 in 15 games. Impressive, nice work! Darrell wins an Onyx Rev Line bat, which was the magic stick that helped him serve up all those base knocks. A well-deserved award for being on base for his teammates time after time getting out only FIVE times in 2026.
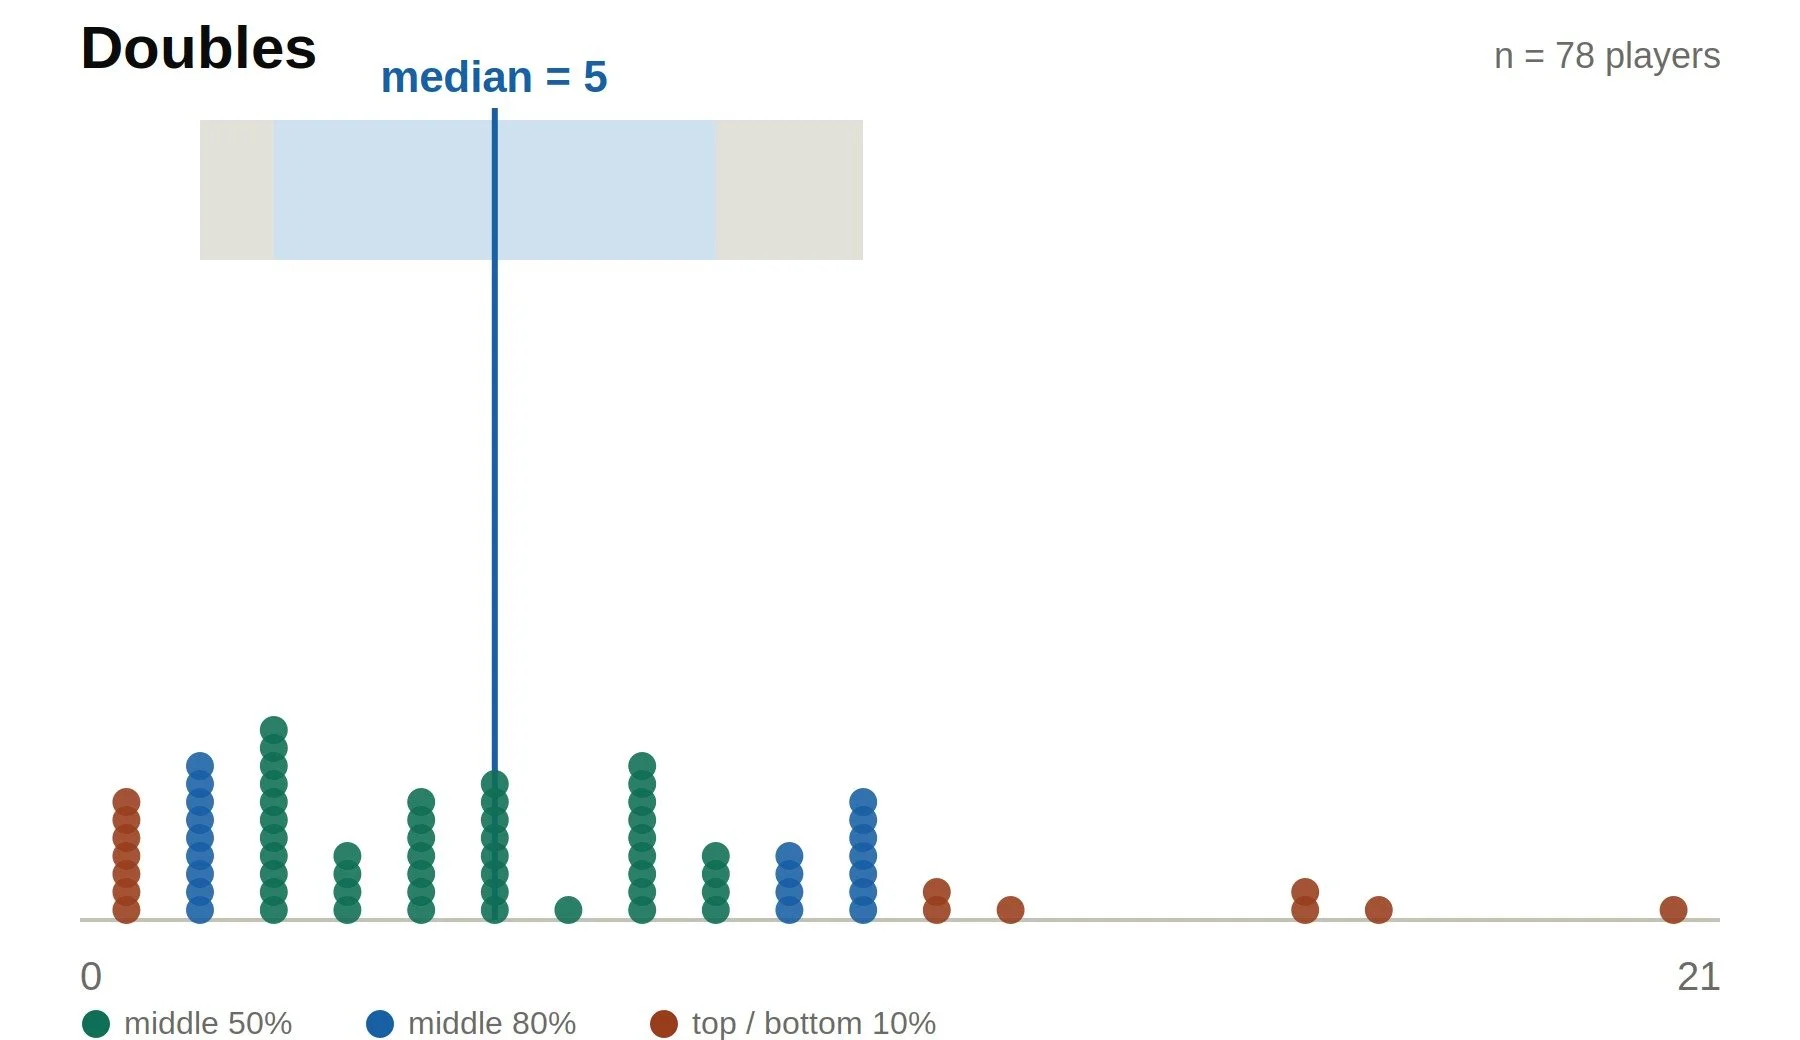
Next, we’ll talk about Will Myers and a dominant season at the plate. Will was 44 for 50 (.880 avg), which is an impressive stat by itself, but when you break down his hits by category, things get really interesting. Of those 44 hits, 13 were singles and 31 were for extra bases. That means that 70% of the time, this man was hitting a double (21), triple (2), or home run (8). Will was in the fortunate position to have teammates on base whenever he came up, which also allowed him to knock in 53 RBI’s. Congrats to Will on a very impressive season!
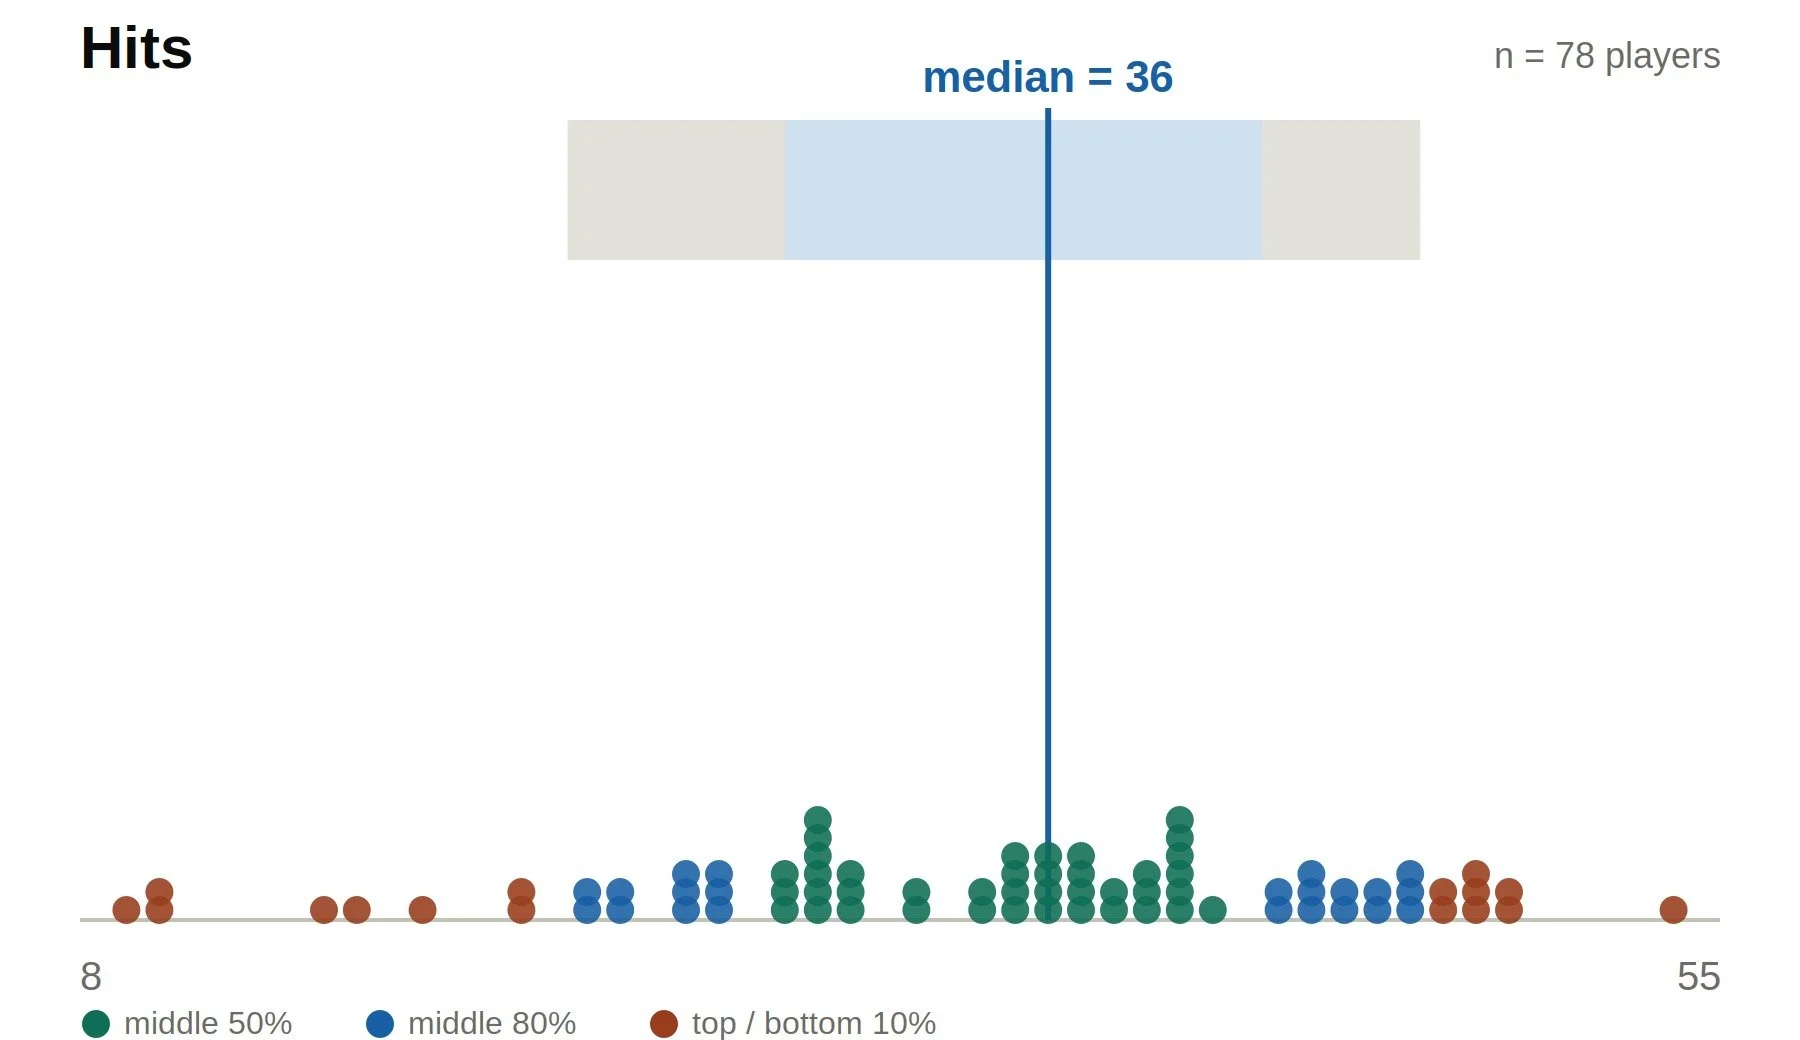
Butch Maciel, to me, is the Cal Ripken of his division. He played in all 16 games, had 68 at-bats, and hit for a whopping .809 for a total of 55 hits. That stat speaks to commitment, endurance, and consistently good hitting and should be celebrated.
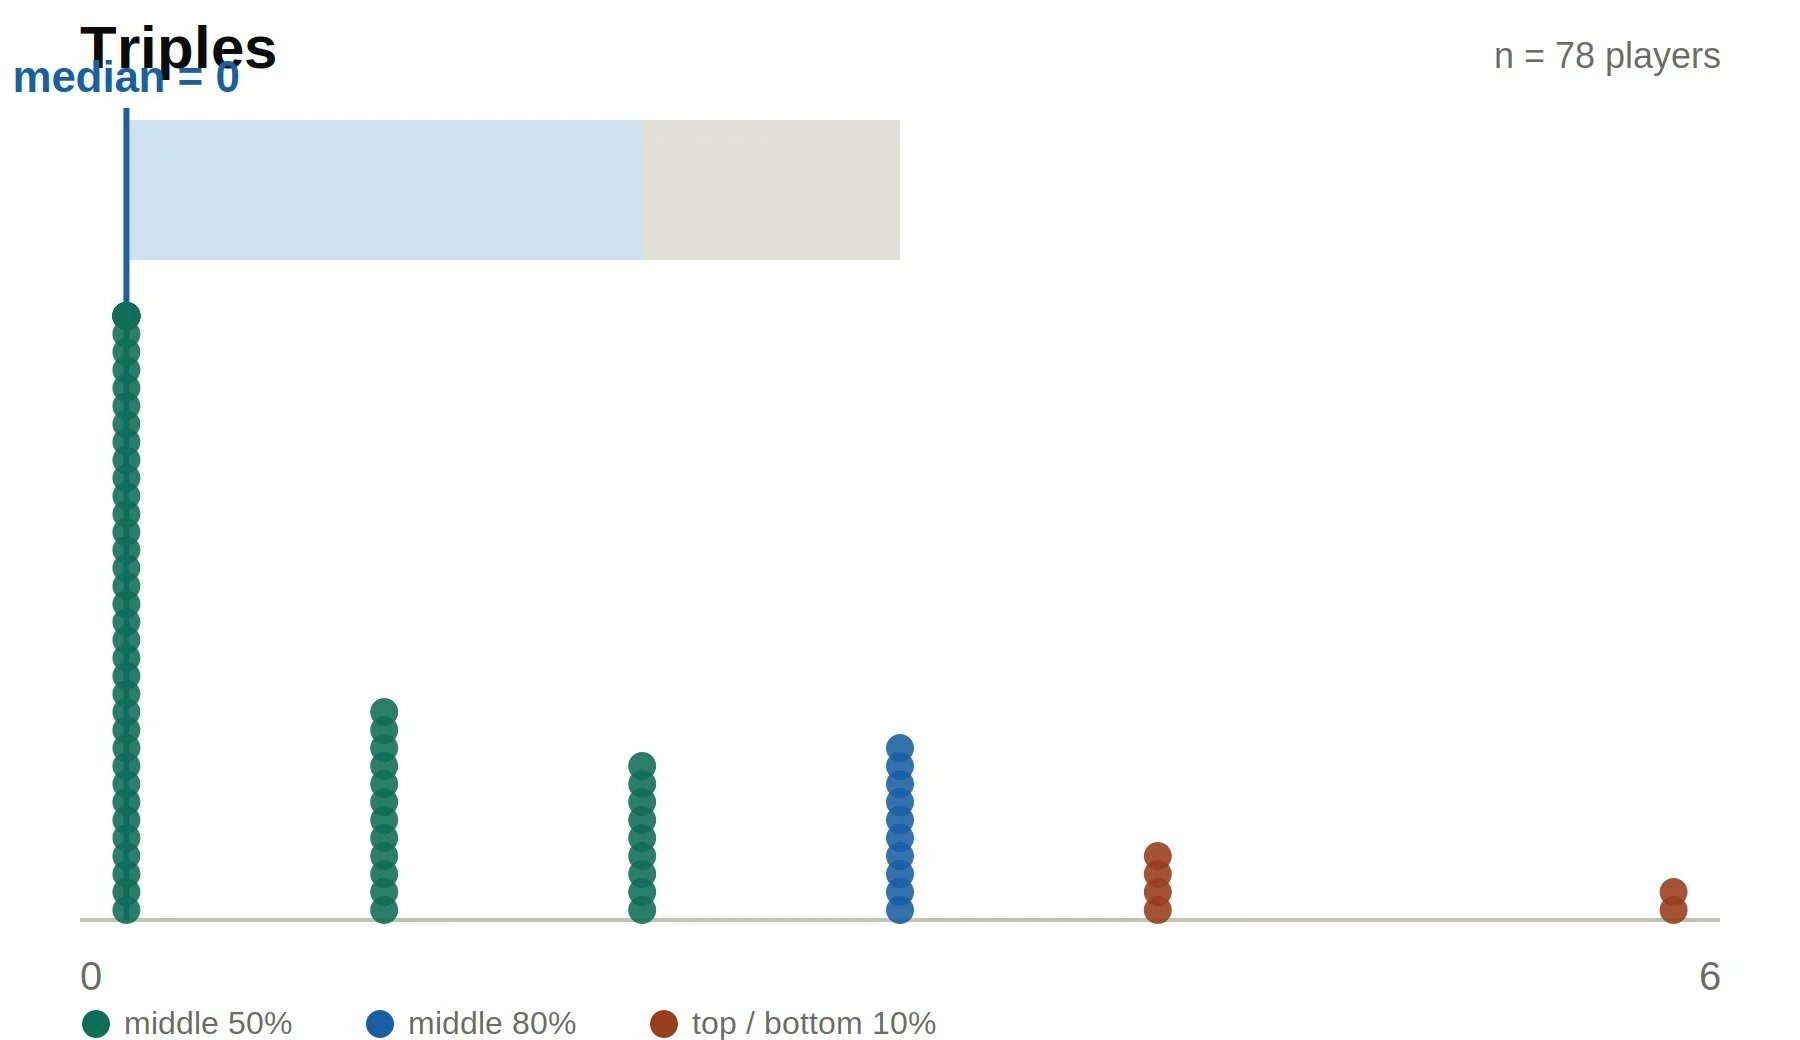
Paul Supat and Max Nelson tied with 6 triples each, which means they are really good at hitting it to hard to reach parts of the field and they can run like the wind. Good job, men!
All of the division leaders will have their choice of an SPSSC hat (the blue and grey ones you’ve seen guys wearing) or a hoodie (in the design process now). Except for Darrell, who won the bat.
About the charts
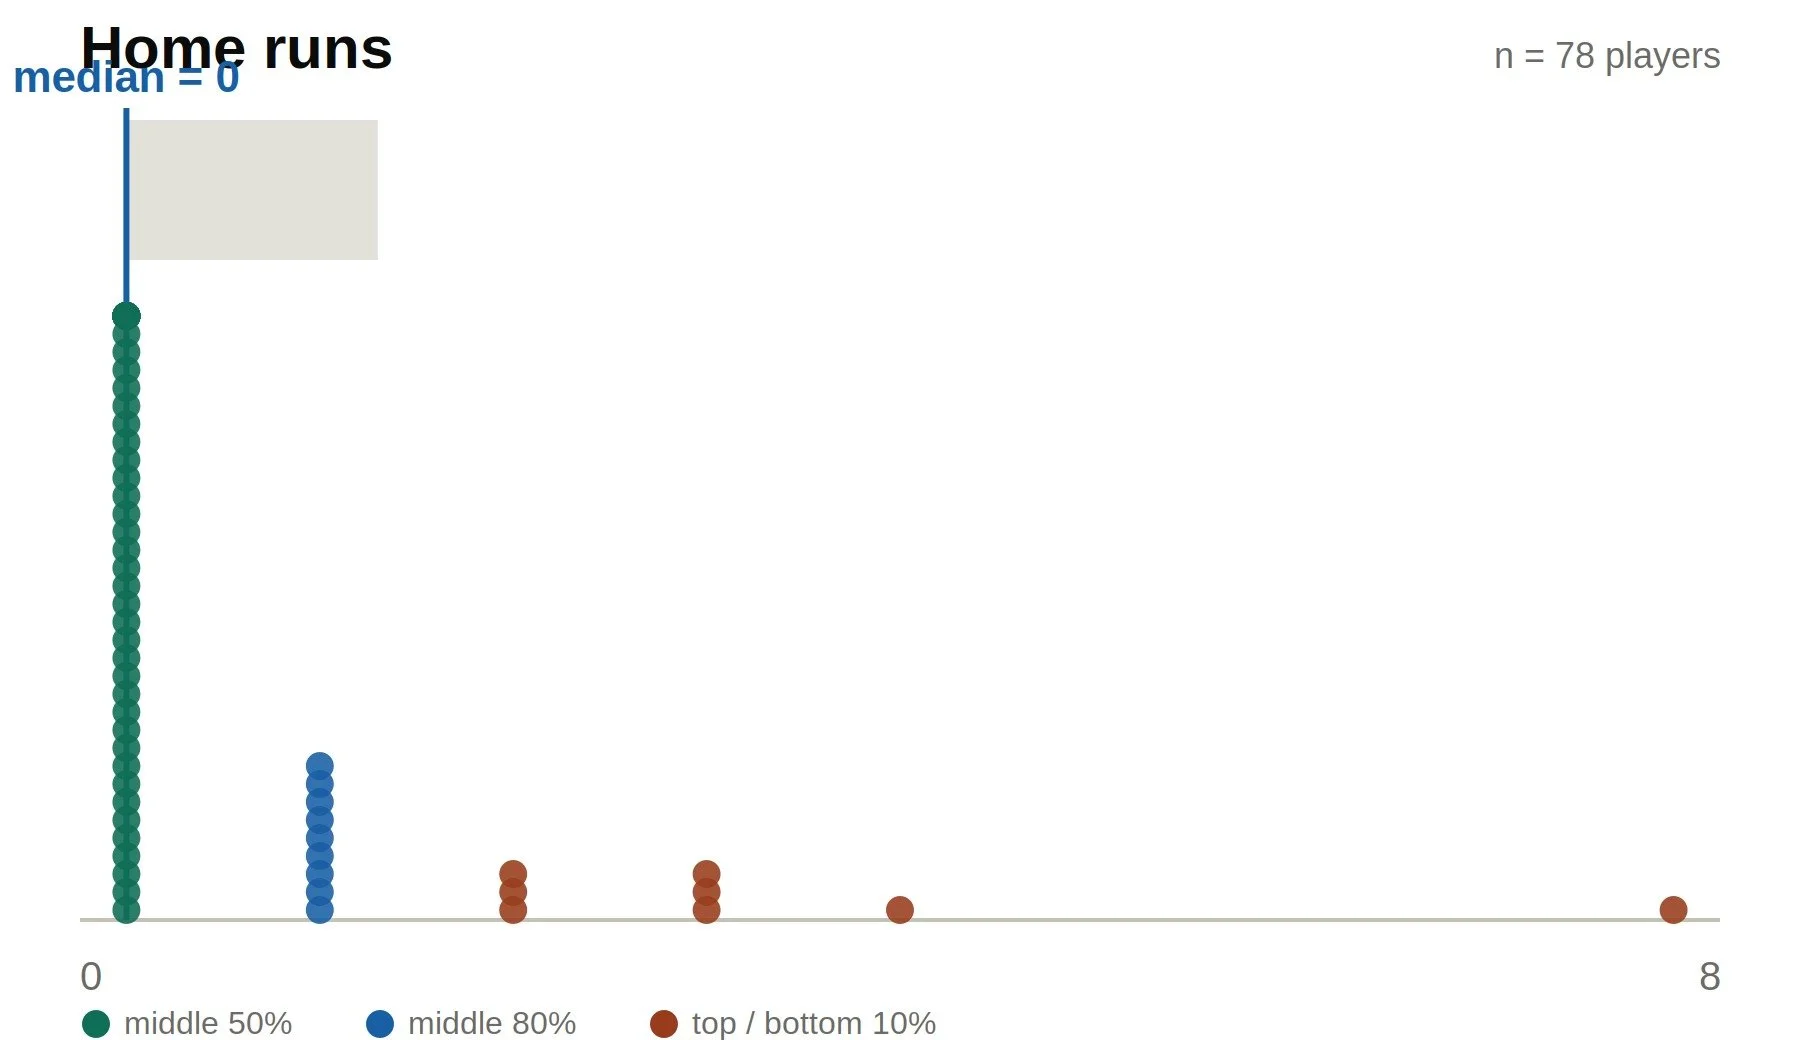
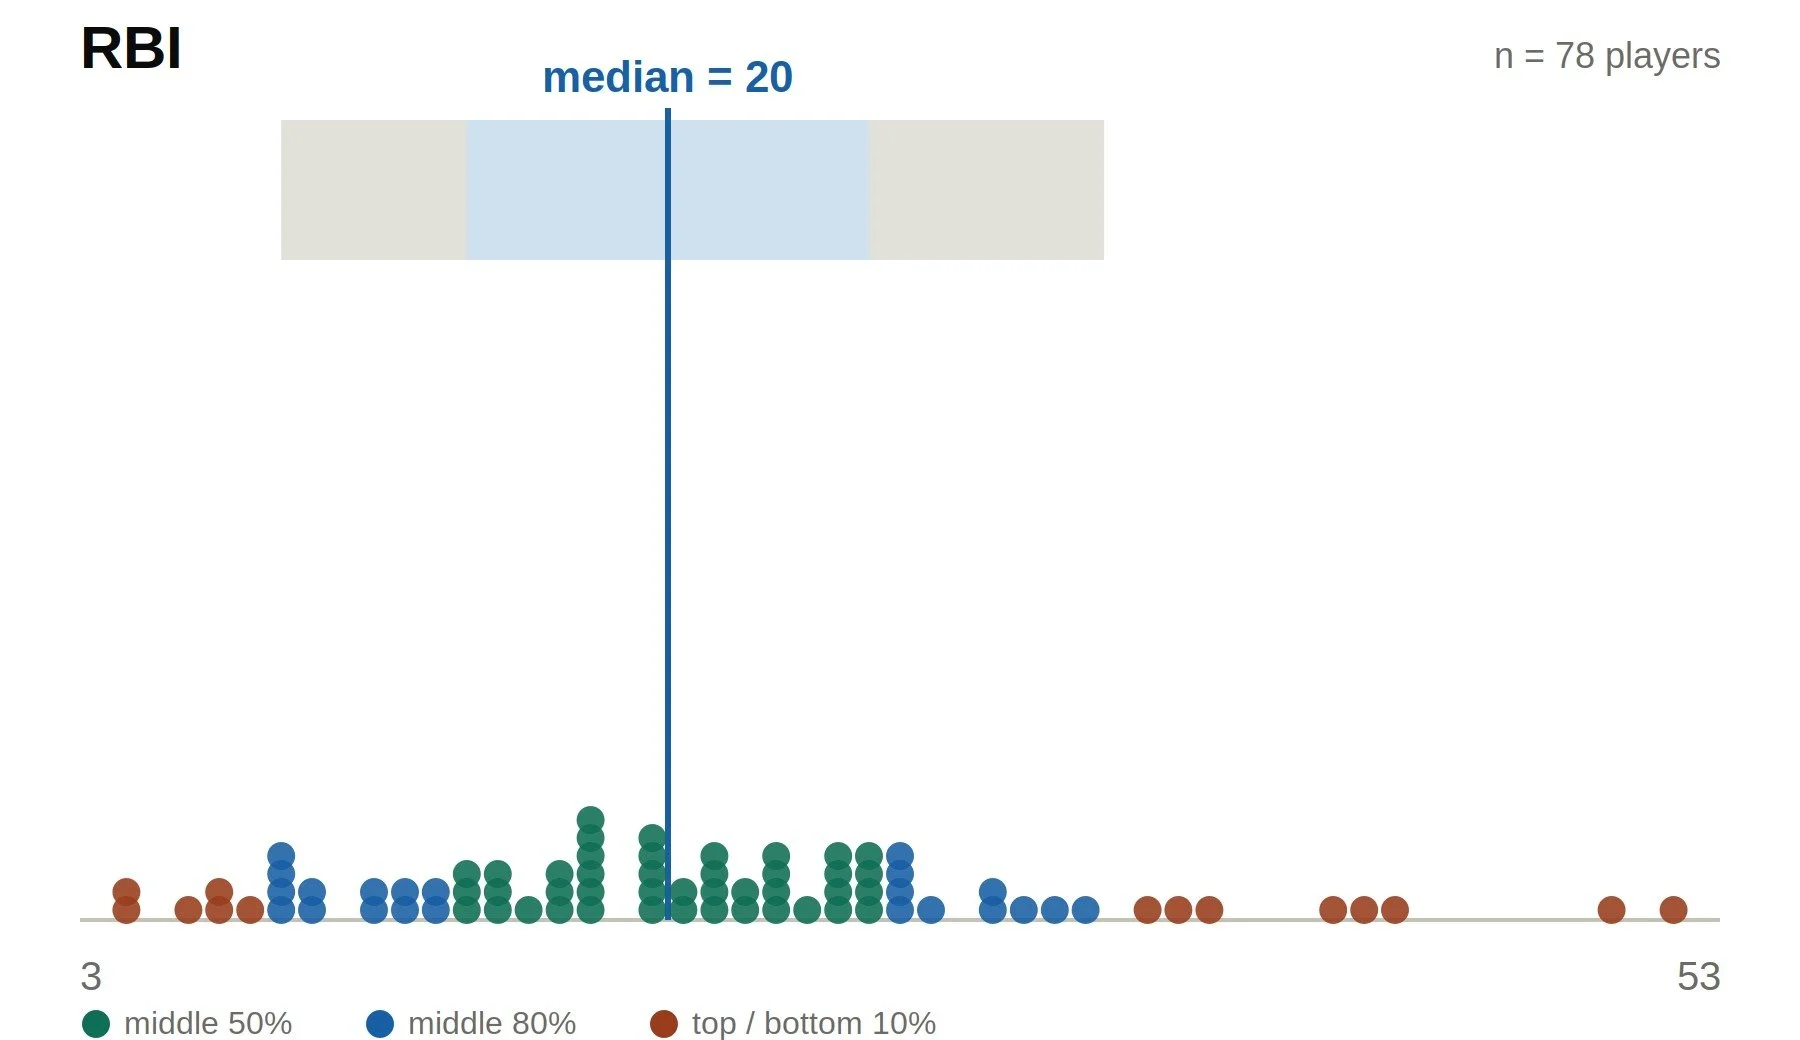
Each chart shows one stat category for the 60s division — batting average, hits, doubles, triples, home runs, and RBI — with every player in the division plotted as a dot.
The blue line is the median — not the mean/average (the number you'd get by adding everything up and dividing). The median is the middle value: half the players in the division are above it, half are below it. We used the median instead of the mean because a few standout hitters can drag the mean upward, making it look like "the average player" did better than most players actually did. The median isn't distorted that way — it reflects what a typical player in the division actually produced.
This mattered most for triples and home runs, where most players had zero of either. The mean home run total (0.5) made it look like the average guy hit a home run every other season. The median (0) tells the real story: over half the division didn't hit one at all, and the total was carried by a handful of players.
The shaded bands show how spread out the division is:
The darker inner band is the middle 50% of players — the range a typical player falls into.
The lighter outer band is the middle 80% — a broader "normal range."
Dots outside both bands (colored differently) are the top and bottom 10% — the standout performers and the players furthest below the pack.
The dots are every individual player in the division, stacked up at their value. Where a column is tall, a lot of players landed on that exact number.
60s division MEDIANS, 2026 season
Batting average: .719
Hits: 36
Doubles: 5
Triples: 0
Home runs: 0
RBI: 20
Based on all 78 players with recorded stats in the 60s division, 2026 season.